For years now, I keep trying to explain why you can’t look at ARPU trends to determine trends in pricing. Conflating ARPU trends with pricing is one of those zombie fallacies – we can’t seem to kill it no matter how hard we try. But I am going to give it another go anyway.
Last week, the government released its annual review of telecom prices [full report pdf, 1.8MB]. The report found that “prices for most wireless and home Internet services declined in 2023”. Notably, the media release observed that mobile prices in Japan and the USA were consistently higher than those prices paid in Canada. It is also worth noting that the study was conducted using October 2023 price data. Since then, Canadian mobile prices have dropped more than 10%, while prices have increased in many of Canada’s peer countries.
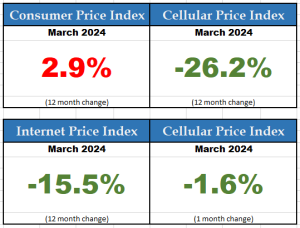
We have seen Statistics Canada regularly reporting declines in mobile pricing of more than 25% as part of its monthly Consumer Price Index.
So, why the disconnect with ARPU?
ARPU is a financial analyst measure that calculates average revenue per user, by taking the total wireless service revenues and dividing by the number of subscribers. But, as I wrote 11 years ago, “Not all ARPUs are the same”. It just isn’t the same as unit prices.
Last summer, I wrote another post on the subject, “ARPU doesn’t measure price”.
That was a follow-up to a piece I wrote in 2017. I complained at that time about a number of Canadian telecommunications industry observers who confuse ‘ARPU’ with ‘prices’. Plus ça change, plus c’est la même chose.
I recently saw a post about per capita grocery spending in Canada that resonated with me:
Food retail sales in Canada still dropping, based on new data from Statistics Canada (February 2024).
The misery continues… pic.twitter.com/Up4f8sRmO1
— The Food Professor (@FoodProfessor) April 24, 2024
Per capita grocery spending is down 26% over the past 4 years. Is there anyone who would look at that statistic and conclude that food prices are lower now? Of course not. Clearly, average revenue per user for Canadian grocery stores has been declining. Sounds like ARPU, right? But, we also know that the price of food items has been one of the biggest drivers of inflation. Our consumption habits change, which contributes to shifts in overall monthly spending patterns. That same reality applies to groceries and mobile services.
The items in our shopping carts today are different from the items we bought 4 years ago. It is no different for mobile services. Plans today deliver more data, faster speeds, wider calling areas and can optionally include international roaming.
So, why do so many have trouble separating flat or slightly rising wireless ARPU from falling wireless prices? Maybe it is people who don’t pay for their own phone service, or folks who have an agenda. I recently told a morning talk radio audience to call their service provider or visit any shopping mall if they haven’t looked at their mobile plans recently.
More for less. The opposite of shrinkflation as some might say. Indeed, as I have already said.
Can we finally put this to rest? ARPU trends aren’t the same as price trends. And, contrary to the assertion of some, ARPU trends aren’t representative of consumer bills either. But, that will be the subject of a future post.