ARPU (average revenue per unit) is an important metric used by financial analysts to compare service providers. It is a good proxy for the average size of a bill, but it is not an effective way to compare prices, or to track pricing trends.
For certain, the prices of services impact your monthly bill, but there are many factors at play when looking at ARPU as a key performance indicator. Earlier this week, in RBC’s Q2/23 Review of Canadian Telecommunications Services, we read “While we believe Canadian telecom stocks/valuations continue to be sensitive to quarterly wireless ARPU growth, we continue to believe wireless ARPU as a KPI has major limitations and therefore must be sized up alongside other wireless KPIs (i.e., subscriber growth, churn, network revenue growth, margins, lifetime value per subscriber).”
RBC noted the evolution of wireless ARPU definitions over the past decade, including shifts driven by IFRS accounting standards (as I described the last time I wrote about ARPU and prices). The definition of the denominator units, the “U” of “ARPU”, has evolved from wireless subscribers to mobile phone subscribers, to now exclude tablets, hot spots and wireless home phone connections.
 For the past two months, the cellular component of Statistics Canada’s Consumer Price Index has reflected dramatic decreases in prices, approaching a 15% drop year-over-year. These results aren’t really a surprise to those of us who watch the industry and have seen a nearly continuous stream of lower prices, triggered in part by Quebecor’s absorption of Freedom Mobile, and in part the integration of Shaw with Rogers.
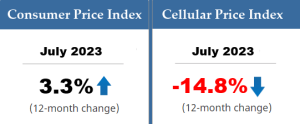
All industry participants have significantly lower priced plans available now than a year ago. Statistics Canada says mobile prices in July 2023 were 14.8% lower than July of 2022.
BREAKING: New @Statcan_eng data shows Canadian telecom service prices continue to fall & have been a main contributor against further inflation
As per the data:
-Cellular prices were down 14.8% year-over-year in July
-Prices for internet access were down 3.8% year-over-year1/2 pic.twitter.com/aj8fJGLxWN
— Canadian Telecommunications Association (@CanadaTelecoms) August 15, 2023
So, why isn’t that price reduction reflected in the carriers’ reported ARPU? Because ARPU reflects what services consumers have chosen to pay for, while StatCan’s price index tracks, in the words of StatsCan, “pure price change”.
There are many factors that contribute to ARPU variations, such as the product mix and choices of services by subscribers.
To help understand, let’s consider monthly lease payments for a car. Let’s assume that when you last looked at cars, you had a choice between a small car, mid-sized vehicle and a full-sized model. When you considered your budget, you chose to lease the mid-sized model. Now, you start looking for a new car and you find that monthly lease prices are actually down 15% across each class of vehicle – yes, I know that this bears no relationship to the crazy increases in car prices, but work with me here.
So let’s say you find that lease prices are down 15%. You have a choice to stick with the class of car you have at a lower monthly payment, or you may decide to pay a bit more and get more car for your money. If you chose the latter – more car for the money – would you conclude that car prices haven’t gone down? Or, would you acknowledge that you are getting more for the money, and prices have gone down?
Let’s put that in terms of mobile telecom. CRTC figures show that mobile data usage has been continuing to climb, almost 20% year over year in the last reported quarter (3Q22). One national carrier indicated on its recent analyst call that the average increase in data usage by its subscribers is now closer to 50% year-over-year. CRTC figures also show that ARPU has been relatively flat.
That does not mean prices haven’t gone down or, as some commentators have suggested, that the telecom bills for all Canadians have stayed the same. It means that while many Canadians have had their bills reduced as a result of lower prices, others have elected to upgrade their service plan because with lower prices and added data allotments they see the value in upgrading to a different plan.
ARPU doesn’t measure price; Statistics Canada, Canada’s official statistics agency, does measure prices of cellular services as part of the monthly Consumer Price Index. As reported this week by Statistics Canada, mobile prices have declined nearly 15% in the past year. People are getting more service for less money – growing at a rate of about 20% per year.
ARPU simply isn’t the same as looking at prices. Instead, ARPU reflects different consumer choices responding to changes in price.
Mobile prices are lower than ever before. In these inflationary times, that is something to celebrate.