A couple of years ago, I wrote a piece that looked at 4 different ways to measure affordability of telecom services: Income-based affordability; Expense-based affordability; Relative affordability; and, Subjective affordability. I wrote that affordability is a complex and multifaceted concept, that is dependent on the context and the goods or services being considered. I observed that economists may use one or a combination of these approaches to assess affordability in different situations.
In that piece, I also wrote:
In a 2015 report [pdf, 2.1MB], the Public Interest Advocacy Centre (PIAC) said “We suggest that communications services are “affordable” where, as a guideline, they make up about 4% to 6% of a household’s income.” In 2017, PIAC found that low income households considered home internet to be equally important as health care.
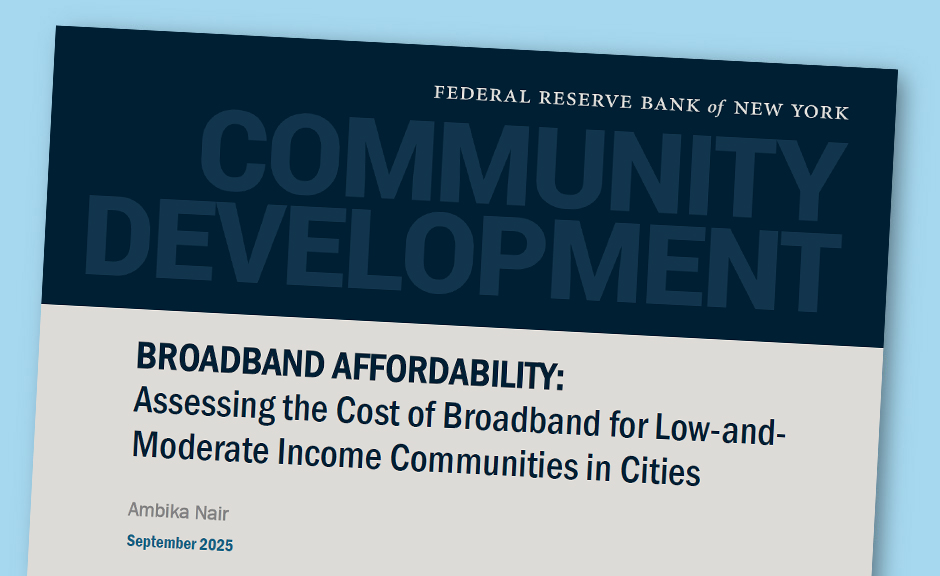
So I was very interested to see that the Federal Reserve Bank of New York released a study on Broadband Affordability last week [pdf, 634KB]. Among its key findings: “Low- and moderate-income communities pay a notably higher share of their income for broadband — 2.43% compared to 0.51% in wealthier areas — exceeding the FCC’s 2% affordability benchmark.”
 I shouldn’t have to point out that for low and moderate income households, just about everything costs more as a percentage of income than it does for wealthier communities. Basic arithmetic teaches us that happens when the denominator gets bigger.
What I was interested in was how this compared to Canadian figures. As it turns out, Statistics Canada tracks a lot of this kind of information on its Telecommunications Statistics portal. The data shows that spending by all Canadians has been hovering around 1% of total expenditures, and for the lowest income quintile, broadband has remained under 2% of total expenditures.
Please note that this chart looks at broadband affordability as a percentage of total expenditures (expense-based affordability), not total income (income-based affordability). Total expenditures is almost always lower than total income, the percentage of total income would be even lower. In 2023, Statistics Canada reported the figure for total expenditures for the lowest income quintile was $42,240.
It is also interesting to look at trends in what households are spending for broadband service. We can see that monthly expenditures have increased over time, from 60 to 80%. A major part of that has been due to families choosing to subscribe to faster, most robust services. In addition, especially in lower income households, more families are now choosing to subscribe to broadband for the first time, which has the effect of increasing average expenditures.
In the CRTC’s Canadian Telecommunications Market Report 2025, the section on Prices and Affordability confirms that prices have been falling, with gigabit services down 35% and 50 Mbps services down 25% in the period from January 2020 to September 2024.
There is a lot of interesting information in the NY Fed report on broadband affordability. The first message I gleaned was that Canada is far ahead of the US for affordability and adoption of broadband, even for our most vulnerable communities.
More can always be done, but with the cost of living figuring so prominently in political debates these days, the data shows that Canada is doing much better than the US for affordability of broadband services.
