Earlier this month, I promised to explain why ARPU doesn’t reflect consumer bills. In that post, I explained why ARPU trends aren’t the same as pricing trends.

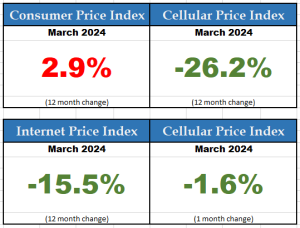
Studies from ISED and monthly Consumer Price Index reports from Statistics Canada reveal significant lowering of mobile service prices.
At the same time, disinformation campaigns have said these price reductions aren’t showing up in consumer bills. Their evidence? Quarterly financial reports from service providers include an indicator, Average Revenue per User (ARPU). Industry critics say that ARPU is a proxy for monthly consumer bills, and ARPU has remained relatively flat compared to the dramatic fall in plan prices.
On Twitter, Prime Minister Justin Trudeau took the credit, saying “We’ve cut the cost of cell phone plans in half since 2019 — in part by increasing competition.” Opposition MPs and industry critics misread the post, confusing “plans” with “bills”, and then confusing “bills” with “ARPU”.
Hey @JustinTrudeau. I know you don’t pay your cellphone bill – but here is the money Bell Canada has made per cell phone user as of March 2024. Does this look like a 50% drop?
We need competition not complacency to drop the highest cell phone bills in the G7. https://t.co/fmOpmldQlf pic.twitter.com/O89h2hISHR
— Ryan Williams (@Ryan_r_Williams) April 19, 2024
The problem is, ARPU simply isn’t a proxy for consumer bills.
Service providers have different ways of calculating ARPU. Broadly, wireless mobile phone ARPU is “wireless service revenue divided by average subscriber base for the relevant period.” The inclusions in the numerator and denominator can vary between service providers.
Superficially, we could take total consumer revenues, divide by total subscribers and the result would be the average consumer bill. Simple, right? The problem is that ARPU doesn’t just look at consumer revenues and consumer subscribers.
Oops. That is an important detail that gets missed by a number of academics and industry critics.
Let’s consider what kinds of things are included in the numerator. It usually includes more than just consumer service revenues. Most service providers report total wireless service revenues. That means the top line includes lots of things beyond consumer cellular phone plans. Connected cars? Those revenues are in there. Internet of things (meter readings, etc.)? In there. Security system connections? Fixed wireless broadband services? If it runs over the wireless network, the revenues are included in the numerator. Roaming fees are in there, but are dramatically shrinking since consumers have access to plans that include roaming. Overage fees are also becoming a thing of the past. And the $10 bundle savings you received when you combined your wireless with your home phone or internet or TV? That discount is charged to the wireline side; the full revenue is included in the wireless ARPU calculation.
As for the denominator, the ARPU calculation generally uses just the number of wireless mobile phone subscribers. So there is a mismatch between the revenues included in the numerator and the number of units included in the denominator. Consumer phone prices are dropping; most consumers have substantially lower monthly phone bills, but neither of these trends show up in the ARPU, because there are other sources of revenue being generated by the service providers. Those other sources of revenue have nothing to do with consumer revenues – or consumer bills.
As a result, ARPU may be a useful financial indicator for analysts, but it does not reflect consumer bills. ARPU is one of the many financial measures used by investors. It simply isn’t meaningful as a proxy for what consumers pay. That is why I continue to push back on those who keep spreading the misinformation.
I’ll repeat what I told a talk radio program last month. If you haven’t looked at your mobile phone plans in the past year, call your service provider or visit a shopping mall today. It is much cheaper for most plans than it used to be.

It is weird so that while mobile plan prices felt quite considerably (I’m paying $20 now what cost like $40+ 5 years ago), ARPU for Canadian telcos is flat or moderately positive.
For example, Rogers Q2’24 ARPU grew 1% from $56.79 to $57.24.
So, how much more expensive are other mobile connections supposed to be to mitigate this reduction in prices?
Are telcos “massaging” the numbers to show growth?
As I wrote in the post, ARPU does not simply reflect the average of consumer bills. The calculation is generally (total wireless revenues) / (number of consumer connections). Revenues from non-consumer accounts are increasing (“Connected cars? Those revenues are in there. Internet of things (meter readings, etc.)? In there. Security system connections? Fixed wireless broadband services? If it runs over the wireless network, the revenues are included in the numerator.”) So wireless revenues are increasing but the number of non-consumer connections does not increase the size of the denominator. As a result, ARPU has been remaining relatively flat, despite dramatic reductions in consumer prices.