Reliable and resilient networks
We all want reliable and resilient networks. Telecom policy makers, regulators, network planners, service provider executives, customers (large and small), all of us want our communications networks to be available – always. So why aren’t they?
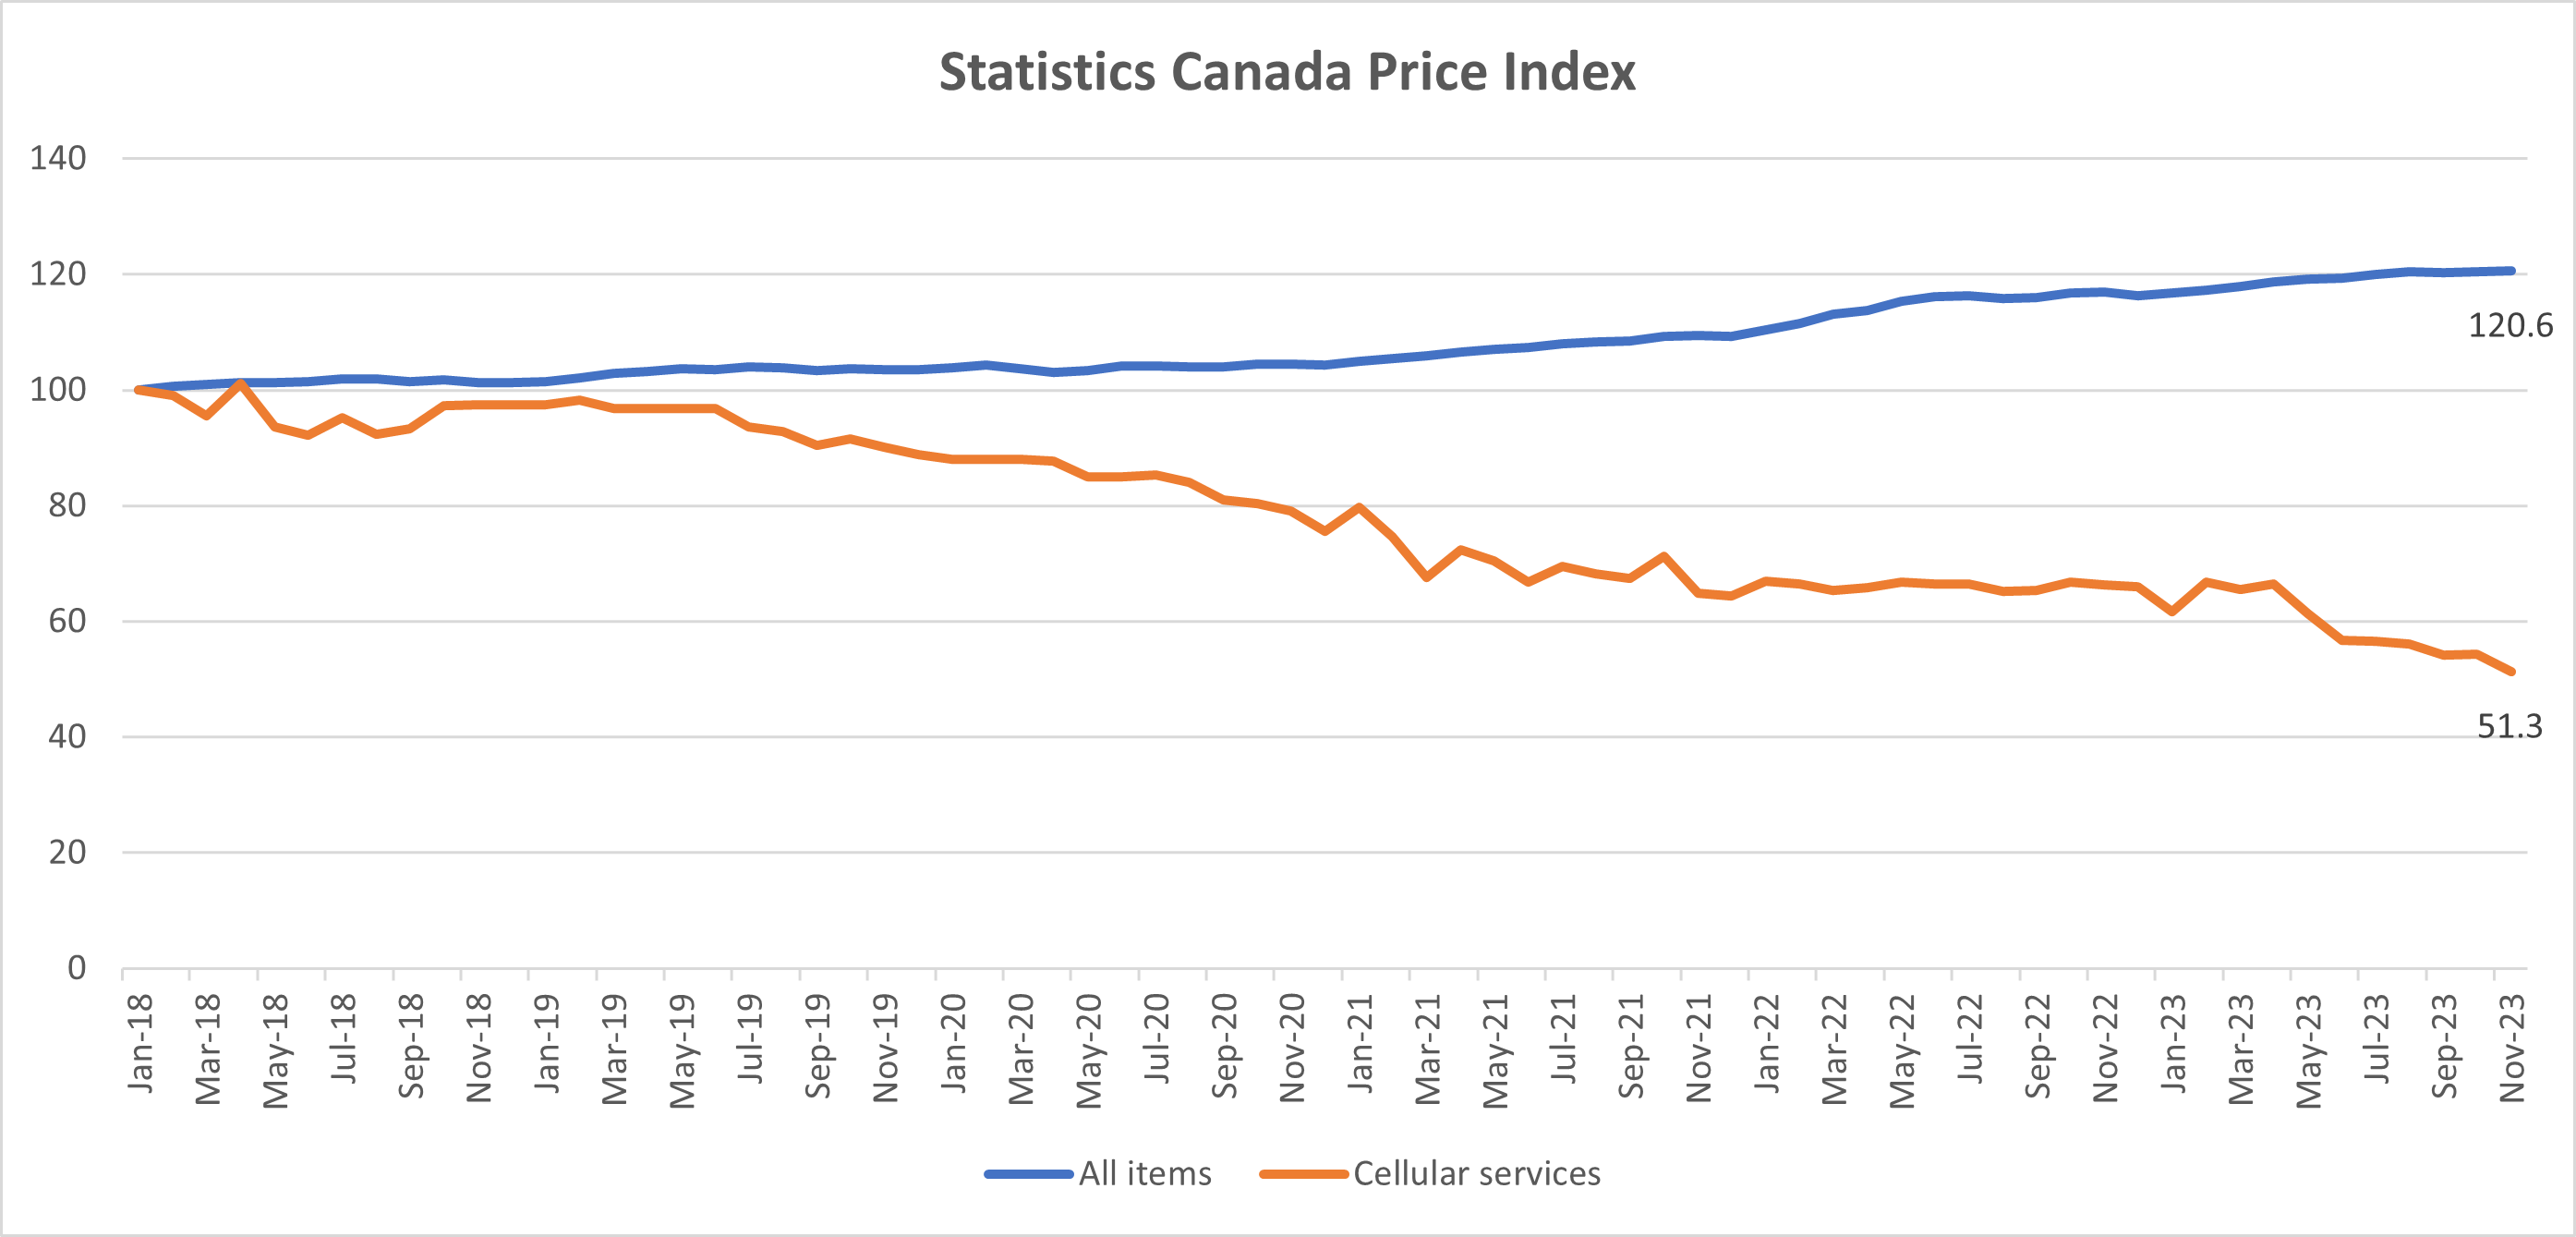
Over the past 4 years, with so many of us working for home, there is an even greater dependence on our voice and data networks. Working from home, schoolwork and classes online, streaming video for entertainment, gaming hand health applications all mean that degradations in data communications are effectively the same as being out-of-service. We have come to expect perfection from our networks, even as competitive pressures drive down prices for service, despite inflationary pressures in the rest of the economy.
How do service providers increase network resilience to meet consumer expectations? When I wrote about the subject last April, I observed, “With all the best preparations in the world, networks will still sometimes go down.” I noted the CRTC’s own storm-related system failure from a week earlier. A year and a half ago, I pointed out that the Rogers network failure of 2022 wasn’t even the biggest network outage that week – KDDI had 40 million customers off the air for 3 days. And just two months ago, Australia’s Optus disrupted service to 10 million customers for 12 hours.
Networks sometimes go down.
In the olden days, defined as the BC era (before competition), telecom rates were regulated in a way that provided monopoly service providers with an opportunity to earn a reasonable rate of return on their investments. Since those rates were tied to capital spending, the Canadian regulator held annual Construction Program Reviews, looking at various categories of planned capital spending, which were tied to various categories of spending and a wide range of service objectives. In this way, the regulator was able to set measurable service standards, and review the levels of capital investment to meet those objectives. The outcome of the review would usually be that the CRTC found the program plans to be reasonable.
Those days are long gone. The overwhelming majority of revenues for most service providers are from unregulated rates. The majority of capital spending is “at-risk” investment, tied to success in the marketplace.
Before the holidays, I noticed a December survey released by a UK-based consumer advisory site. That survey found that 1 in 3 UK households experienced a broadband outage of some kind in the previous 12 months. When asked how many service interruptions exceed 3 hours, the average number of incidents was 33.
It is a remarkably high level of service disruption, but the December results represent an significant improvement over a similar survey conducted 3 months earlier.
Networks will still sometimes go down and weather-related service disruptions will likely be a bigger factor in the coming years.
In a competitive environment, what is the role of regulators in setting standards or objectives for reliable and resilient networks?