 A new report from PwC was released earlier today, “Understanding the cost and quality of networks across the G20” [pdf, 4.2 MB]. The report examines the factors impacting network costs and quality for Canada compared to the rest of the G20, by building a “network build cost index” and a “network quality index”, which assesses network speeds, 4G availability, and consumer video experience.
Today’s report builds on PwC’s 2019 report, “The importance of a healthy telecommunications industry to Canada’s high-tech success” [pdf, 2.3 MB], that found Canadian Mobile Network Operators (MNOs) have:
- 2 times higher capital expenditure (CapEx) per wireless subscriber;
- 3 times higher spectrum costs; and
- 80% smaller scale, resulting in lower purchasing power.
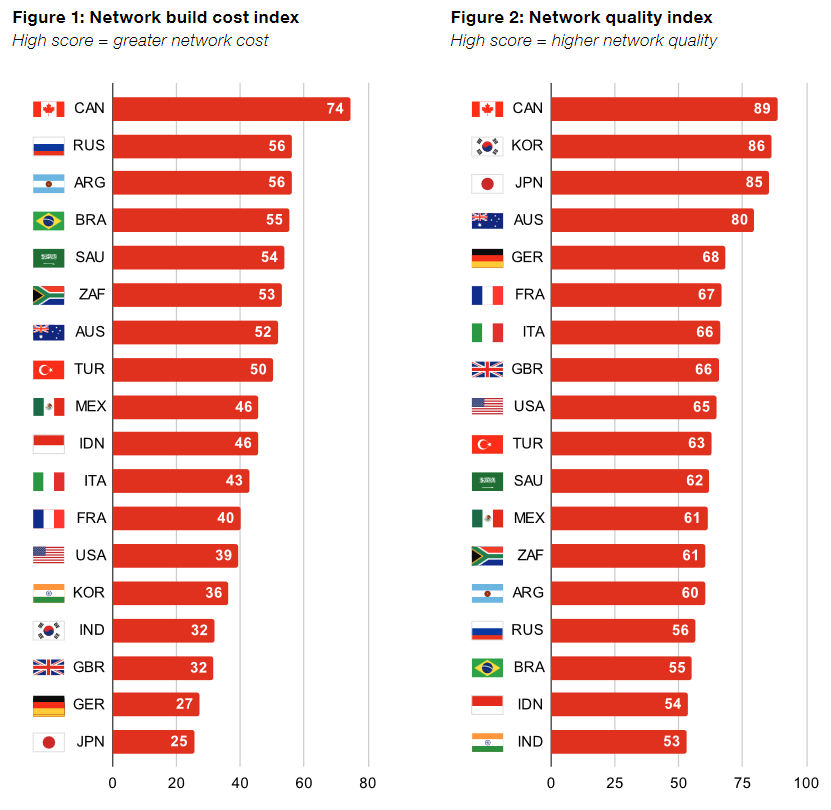
In the new study, PwC found Canada ranks highest in the G20 on the network quality index, leading in terms of network speed, and being among the top countries for 4G availability and video experience. “This means that Canada has both the highest costs in the G20 to build wireless networks, while maintaining leading quality networks.”
The report notes that Canada is the second least densely populated country in the G20, behind only Australia. However, in contrast to Australia, “Canada has many more small towns dispersed across the country, which in part contributes to 50% more cell towers per capita, and 33% higher capital expenditure.”
 The cost of wireless spectrum was found to be the main regulatory cost driver. When PwC reviewed the mid-band 5G spectrum auctions, it found that Canada’s national mobile operators paid $2.62 per MHz/pop nearly three times what was paid by US mobile operators ($0.94 MHz/pop). Even including the regional operators that benefited from set-aside spectrum discounts, Canada’s average of $1.81 per MHz/pop ranked highest in the world for 5G mid-band spectrum, ten to twenty times higher than European peers Germany ($0.19), France ($0.16), and the UK ($0.09).
The PwC report also considers secondary cost factors, such as: wages – Canada’s average is 5th highest in the G20; the impact of weather – limiting construction season and increasing maintenance costs; and, offsets from Canada’s favourable corporate tax rates and lower electricity prices.
Using Opensignal data, PwC’s report found that “Canadians benefit from the fastest networks in the G20 at 59.6 Megabits per second (mbps), slightly faster than South Korea, which is a significantly smaller geography country, and more than seven times faster than India (the slowest).” Canada was in the top 5 for 4G availability, with a connection rate of 93.5%, slightly behind Australia (94.0%), India (94.5%), the US (96.1%) and Japan (highest at 98.5%). With a score of 74.8, Canada ranked third in the G20 for video experience, slightly behind Australia (75.6) and Japan (77.6).
The report’s conclusion? PwC found that costs of building networks in Canada were impacted by its population density characteristics, geography, climate, spectrum policy and regulations, and scale. Still, despite mobile operators having significantly higher cost structures to build networks in Canada compared to other G20 countries, the quality of Canadian mobile networks are atop the G20 and among the best in the world.
As PwC notes, “It’s an achievement worth celebrating, but one that should be recognized in the context of what it takes to build and maintain wireless networks in Canada—especially as 5G networks are rolled out across the country.”